Related Posts
Anybody know if there’s a Toronto Lawyers bowl?
Tell day 8th Nov!

Additional Posts in Excel Genius
Anyone know what these badges are?

Still don't have xlookup. #fomo
Would anyone be willing to teach me vlookup?
New to Fishbowl?
Download the Fishbowl app to
unlock all discussions on Fishbowl.
unlock all discussions on Fishbowl.


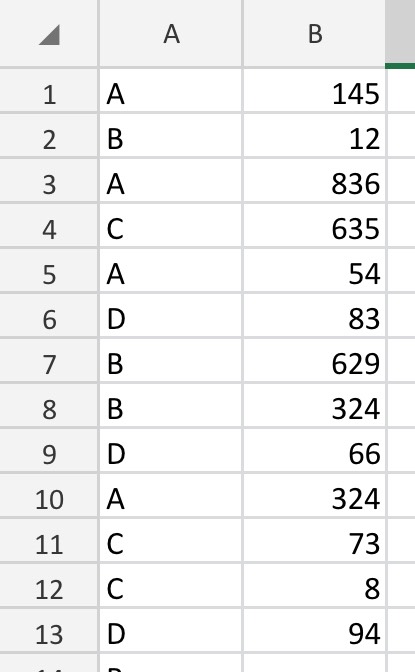
Pivot table
@Lapd1 a YouTube video tutorial shall do you solid. It’s honestly applicable to 80% of situations that require a quick data summary. It’s not super dynamic so depending on specific use cases it may or may not be the best idea but for a simple count/sum/average of # by emp and asset, it is genius.
Use a pivot table. You should be able to break it down from there
Pivot table is easiest as others mentioned. If you need some more complex than a pivot table using filters and countifs (you might need to count rows, which is why it isn’t working for you). I had a similar issue and I’ll look for my post since it had a few solutions.
Note that I ended up switching to powerbi to do this because excel was limited compared to some stuff I could pull off with Dax and M queries that didn’t seem to work as nicely in excel.
Makes sense!
Hi - use a pivot table. When setting it up check the box ‘add to data model’ this way you can do a ‘distinct count’ in the values area.
Oh distinct count is really smart! Thanks