

For a linear regression analysis… the equation of a line is Y=MX+B, where M is the slope. So if I’m measuring a line across 365 days and M=.2, can I say that I have increased production by 20% over a year. Or is production increasing 20% each day?

like
Posting as :
works at
You are currently posting as works at

20% a day is 20% a year unless you're compounding

like

Look at the units. If X unit is day, then M=0.2 implies 0.2 (units Y)/(days). It is not exactly 20%, it is instead 0.2 Y units per Day.

A 20% increase per day would not be linear growth which is what you modeled.

likesmart

Each day because X is one of 365.

like

That would be 20% per year. 20% per day implies that each day is 20% better than the last (day1=100 units, day 2=120 units, day 3=144 units,etc...). Although 20% per year is still misleading and implies exponential growth. It would be more accurate to word it something like 'production has increased by 20% over the past year'.

like

Related Posts

Did you change anything on your resume when you have 2 FT jobs?

like

Does anyone have any insight on picking up a J2 while working for the US Federal Government? Does holding a high security clearance play a role in maintaining a J1&2; as in, will periodic clearance checks for J1 hit on J2?

like

Does Zoom have an employee referral program? If yes, can someone refer me to an open position? Please reach out if so. Zoom

like

How many of you that have been in PA for at least 10 years feel like you are a well rounded individual? Is your personal identity only about your job, status, and wealth or do you have enough contd

like

Pros/cons of government clients? (US Army, USPS, state lotteries, CDC, etc)

like

Has anyone heard anything new on the future of MDC and its agencies in 2019?

like

A friend of mine and I are both starting our life firms from scratch. We both do two different areas of law. How can we help each other with referrals and networking? We live in an area that’s pretty geographically large in two different parts of town.

Hi All, Need some help deciding an offer for IT Audit Senior Internal Auditor Role

1. Job A - 90K + 3500 Fixed Bonus + Unlimited Leaves
Industry Based Role

2. Job B - 84K + 12K Joining Bonus + 20 Leaves Please help.
Big 5 Consulting Role

Any opportunity in Gl in .Net position having 5.2 years of IT experience and 3.8 years experience in .net.

like

I feel like Orrick has such a good rep but in here people seem to complain a lot. Anyone know anything about TCG or corporate?

like

Becoming less and less interested in continuing with the CPA exam. Staff 2 studying for a year with 0 exams passed. What're my options without finishing? I don't think I will actually be able to pass.......

Friendly reminder folks- don’t work for Havas Health and You. They cut the freelancers hourly rates, again and made it so there’s no OT. The resource manager at HOV said if I couldn’t swing $80 an hour as an HCP copywriter, she’d have to find someone else. Good luck 👍🏻

likehelpfulfunny
helpful

How do I sell a product which is not required in the market right now but would be really great in the future (software). Having lot of troubles getting meetings

like

Does Bank of America have a car lease policy ? If yes, which band are eligible for the same ?

like

Can anyone help me with salary range of Associate Delivery Manager?

like

Hello friends,

How is stratacent as a company to join?

like

Thoughts on leaving PA primarily due to the metrics based culture (utilization, dtc, use of X digital tool, revenue, margin, etc). I find this aspect of PA stressful and exhausting but not sure if this is something you just get used to. Currently a manager and seems like the metrics just change over time / don’t get easier.

like

How do MBAs feel about doing one year consulting then a year in industry strategy analyst role vs 2 years consulting?

like

Recent admit here - how important are these pre-MBA Virtual networking sessions? Feeling like it’s hard to network virtually.

like

Additional Posts in Excel Genius

Hi Group, seems like it should be basic format, but I just can not get it to work. a list of data and want to alternate shade (blue,white,blue,etc) each line but if I have multiple lines I want to group together and they all shade the same. I want to group by the same data in column A, and the number of rows that are the same could vary. So let’s say row 1& 2 same entry in column A(blue) row 3 different (white) row 4,5,6 same as each other different to other rows (blue) etc… help 🙏

like

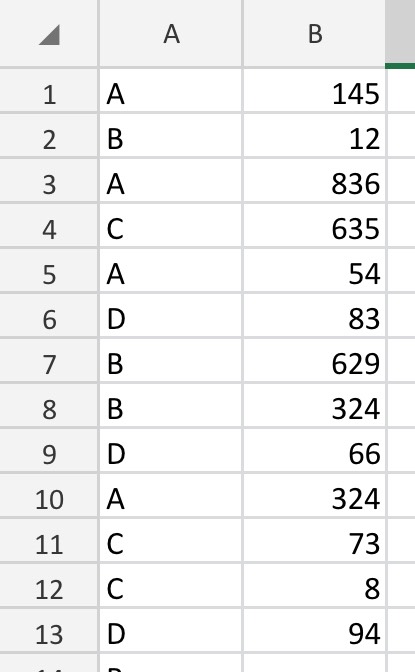
This is dumb, but. How can I pull and average the numbers in column b associated with the 4 values in column a? So, (sum of all As/total number of As) without filtering?

Post Photo
like

How do I compare two sheets to make sure they are identical?

like

I’m referencing a cell (numeric) to a text cell. Is there a way to format that number to include commas? See example in comments.

Help me save the day: have a massive excel file (600k rows) with duplicate records (column a, b and c are duplicate, not a duplicate if a and b are the same though). How can I filter for just these records? If it didn’t crash excel I could concat into one column, Conditional format for duplicates, and sort by color. What’s a work around?

likehelpful

Need help building an electric schedule for a production schedule with a Gantt chart style view (sort of)

Currently have an excel list with resource (production line), start date and time, and then also the name of the item being produced.

Any ideas how to tackle this??

I’m thinking a stacked bar chart with the vertical categories to be my resources and horizontal the date/time and then each individual bar to be the name of the item being produced.

Thank you for the help Excel Gods 🙏

like

How do I set the formula to calculate “If x falls between 1-10, return 1-10, if it falls between 11-20, return 11-20, and so on”

like

Hey fishies, looking for some help with the below

I have 4 lots of data categories which are assigned a code in the adjacent cell
Eg:
Cell A2= 'xyz' Cell B2 = 'w1'
Cell C2= 'ghi' Cell D2 = 'x1'
Cell E2= 'plm' Cell F2 = 'y1'
Cell G2= 'mhn' Cell H2 = 'z1'

The combination of the 'W','X','Y' and 'Z' codes identity a specific trend
I am extracting data which includes multiple combinations of these codes. What is the best way to show frequency of the codes against the category it is assigned to

like

How can I add multiple characteristics within one cell and make sure that a pivot table can read both values independently if needed? E.g., I have a column titled “color” and in one cell I write “red” and the other “red, blue”. I’d like a pivot table / formula to be able to count that there are technically two “reds” in this data set. Any tips?

like

How do I look up values from a column in a row? E.g. Values in A1:A6 in B2:F2?

like

How can I extract just the year into a new cell from a “yyyymmdd” cell (labeled PD here) that isn’t recognized as a date? I basically need to sort this data by year. Thanks in advance!

Post Photo
like

Hey, I have been tasked with teaching some of my coworkers excel from the very basics to more advanced. Does anyone have recommendations on the skills to teach them about? Thank you all in advance!

helpful

Is there a way to identify duplicate URLs within labeled hyperlinks on multiple columns/rows/cells?

I was thinking conditional format, but it’s identifying duplicate labels. I have over 80,000 cells, so extracting URLs manually isn’t going to work for me.

Thanks in Advance!

Does anyone have any tips/tricks for knowing where to plug +1/-1 in a large table with totals across the y and x axis that contain un-rounded numbers? Every time I fix a row I throw off a column or my check figures to the true data source.

Post Photo
like

How long did it take you to become good at excel? Like fast?

like

Is there a way for me to automate creating columns to do this so I can drag across and create my columns? For example--
1Q2021 2Q2021 3Q2021 4Q2021 2021 1Q2022?

likesmart

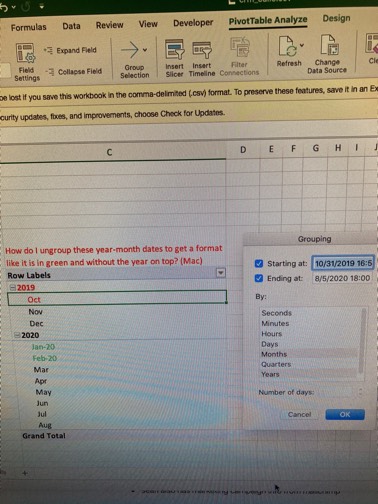
Can dates be grouped just by Month-Year in pivot tables on a Mac without having the year as its own dimension?

Post Photo
like

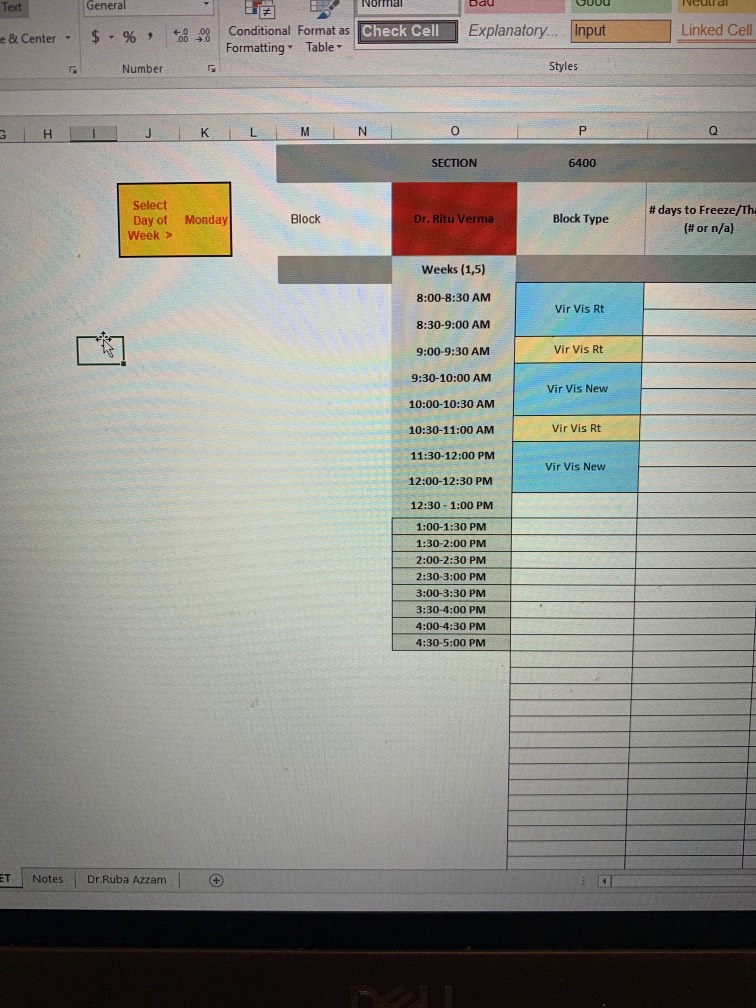
I’m helping my GF with excel and need help lol. She works at a hospital and is trying to make an excel schedule for doctors to reserve rooms. She wants drop downs for days of the week (column K) and also different drop down menus in column P for the reserved time slots.

Is it possible to do this with two sets of drop downs (days of week + time slots) and not use index match here? She could make 5 tables for each day of the week, but prefers one table that can be easily navigated by doctors.

Post Photo
like

Best free data sites to tap into to build a city analysis model? Basically I want to "discover" cities with certain dimensions, like: population, elevation, climate, and proximity to other things (ski resorts, particularly)?

like

After I set a print area, how do I showcase the page 1 - page x in the excel sheet and have the background be grey?

New to Fishbowl?

Download the Fishbowl app to
unlock all discussions on Fishbowl.
That was just a preview…
Sign Up to see all discussions
  • Discover what it’s like to work at companies from real professionals
  • Get candid advice from people in your field in a safe space
  • Chat and network with other professionals in your field
Sign up in seconds to unlock all discussions on Fishbowl.

Already a user?
Login here

Share

Embed this post

Copy and paste embed code on your site

Preview

Download the
Fishbowl app

See what’s happening in your industry
from the palm of your hand.

A phone with Fishbowl app

Scan your QR code to download
Fishbowl app on your mobile

Download app

Sign up for free to view this conversation on Fishbowl

By continuing you agree to Terms of Use and Privacy Policy

Already have an account? Log in

Sign up for free to continue using Fishbowl

By continuing you agree to Terms of Use(New) and Privacy Policy(New)
Messaging rates may apply

Already have an account? Log in

For account settings, visit Fishbowl on Desktop Browser or

General

Legal