
Posting as :
works at
Related Posts
More Posts
Best big4 culture for TP in NYC office?
Chief

Enthusiast
an Elementary School Music Teacher

Additional Posts in The Worklife Bowl
Rising Star

Enthusiast
Enthusiast
Conversation Starter
Chief
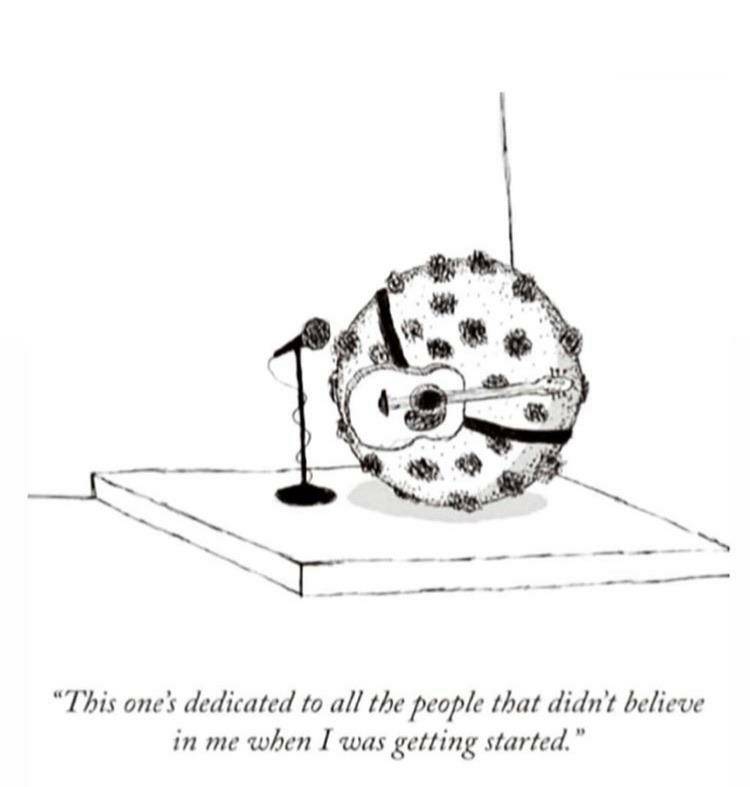
Let's hope there isn't an encore.
Conversation Starter
Visual Storyteller
Enthusiast

Chief
Chief
Rising Star
Conversation Starter
Here’s an animated chart that shows how COVID-19 cases and deaths have grown globally compared to their causes of death like fire, influenza, and malaria over the same time frame. The timeline begins on January 1, 2020, and COVID-19 starts at the very bottom of the chart with zero deaths.
https://public.flourish.studio/visualisation/2634167/?fbclid=IwAR3SfwQFl7UkyJ-DIYp1D_Y1idQM-tHdpuqVdK7SpMxqNI2sA-dO7-5qFS8
Conversation Starter
Chief
Enthusiast
New to Fishbowl?
Download the Fishbowl app to
unlock all discussions on Fishbowl.
unlock all discussions on Fishbowl.

