

Related Posts

Bowl Leader


Conversation Starter
Additional Posts in Excel Genius



Would anyone be willing to teach me vlookup?



Visual Storyteller

Anyone know what these badges are?


New to Fishbowl?
Download the Fishbowl app to
unlock all discussions on Fishbowl.
unlock all discussions on Fishbowl.


Go ask r/excel and say some really incorrect solution. Someone will try one-upping you
Shockingly this is actually really good advice and I have done a similar thing in the past over at r/powerapps lol
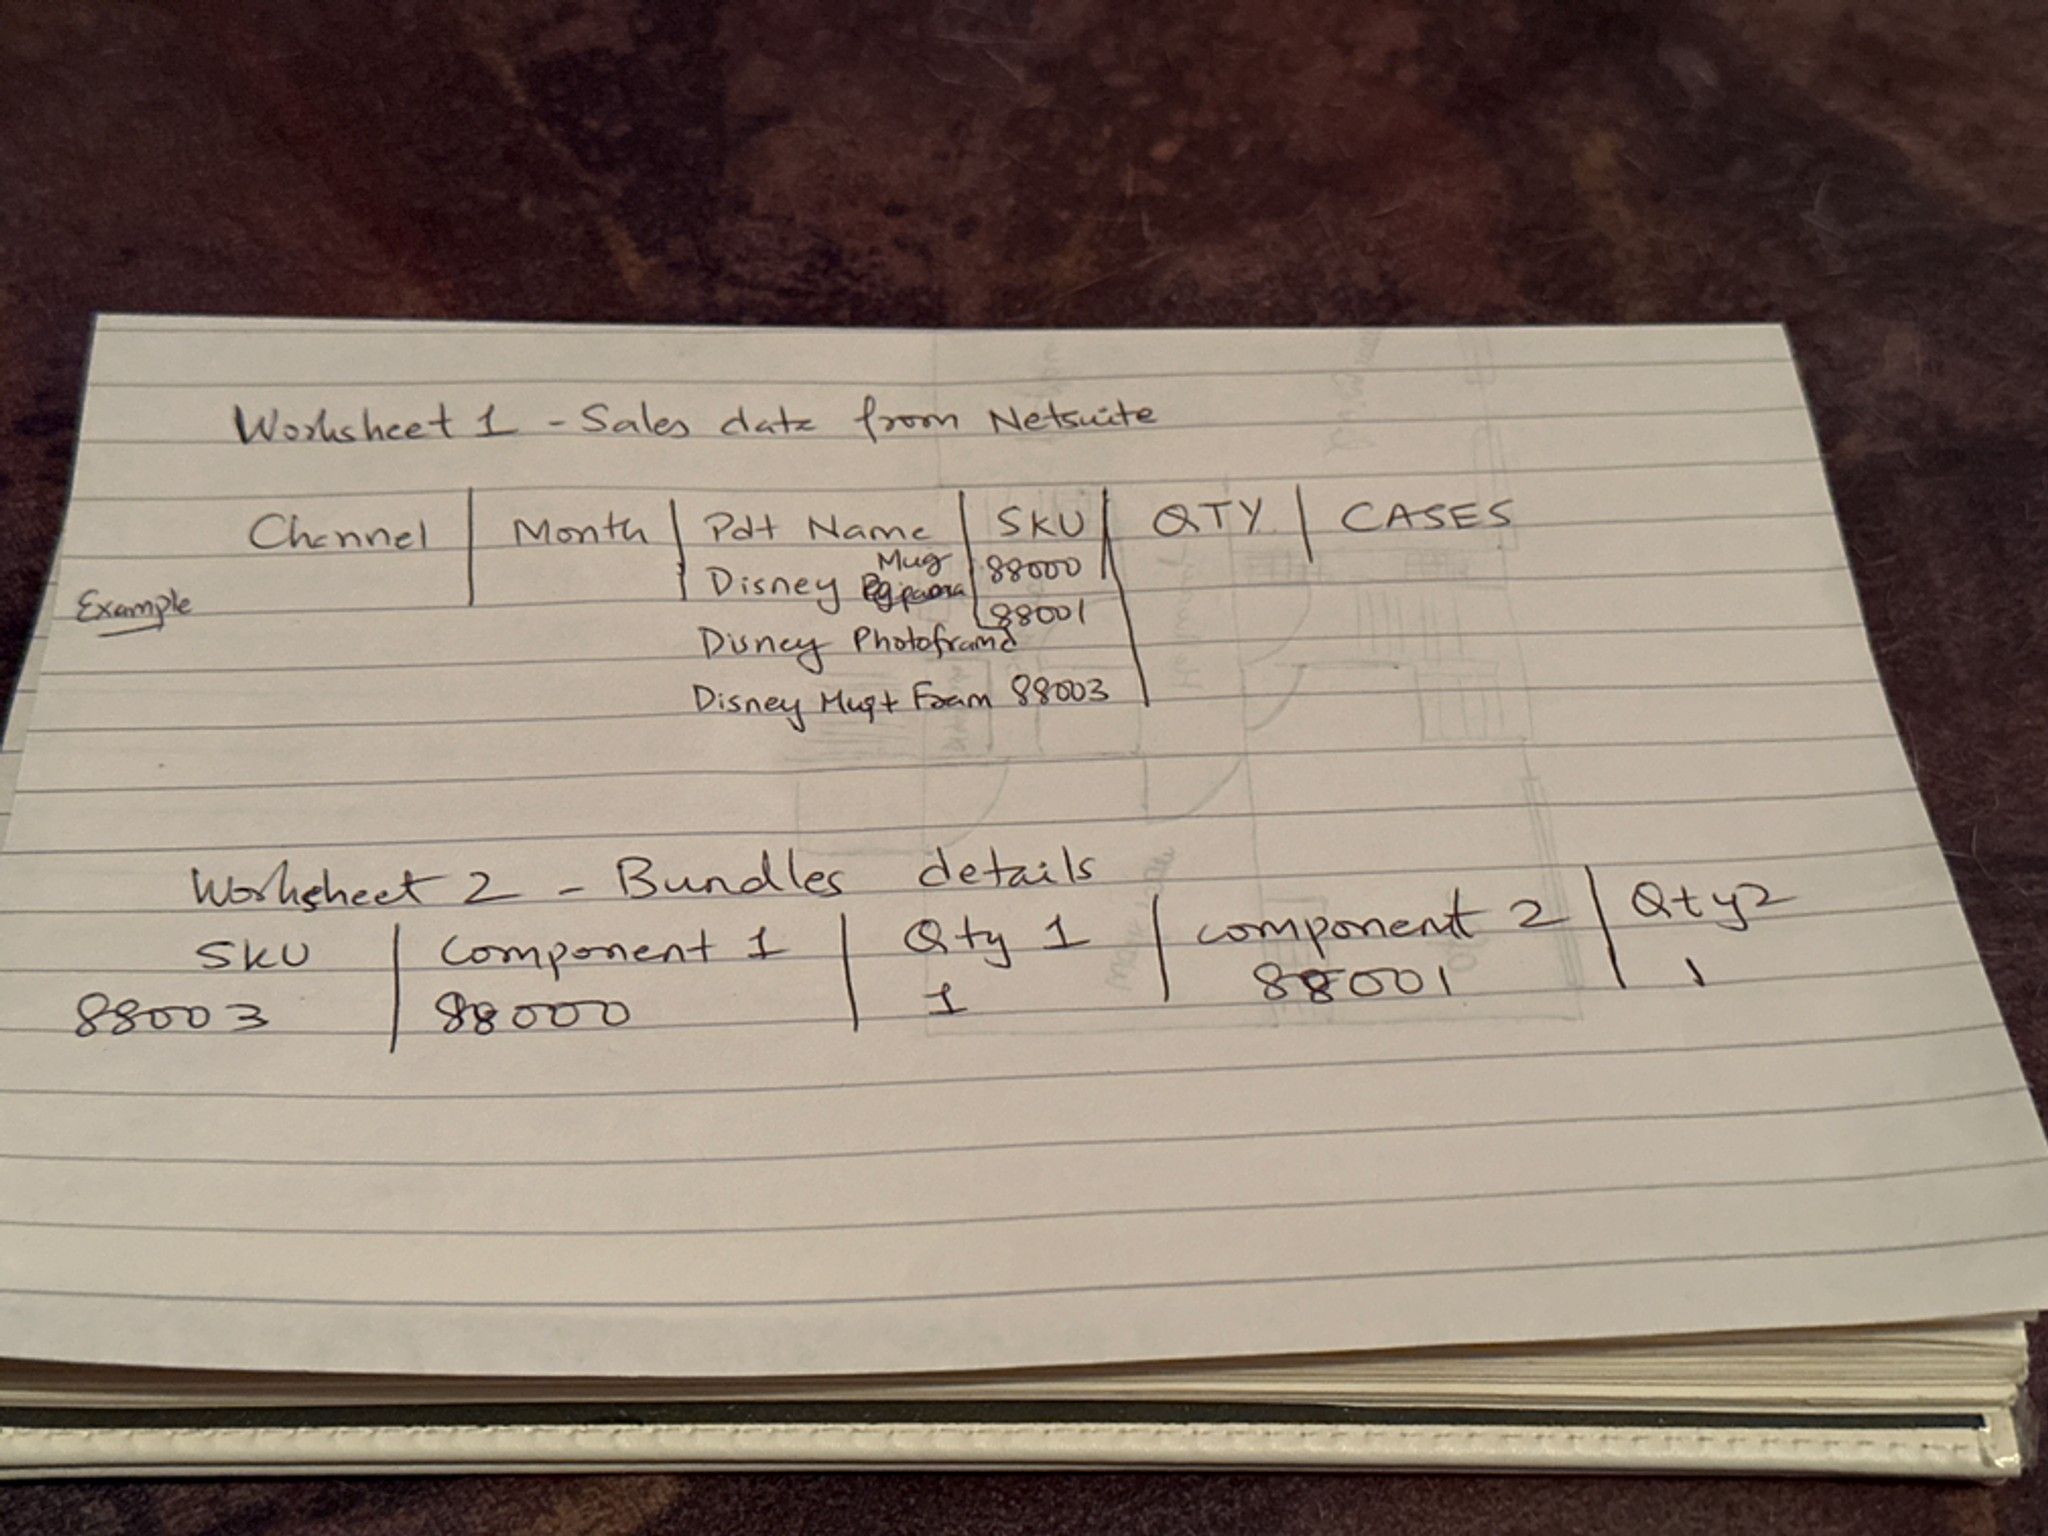
Can you put an example of how you’d like the output to be. Coz I’m not sure I followed you well
Just wanna make sure I followed do you mean bundles as in BOM (Bill of materials)?
Looks like you have 3 skus. 1 is product A, 2 is product B, and 3 is product A&B? So you’re trying to show if sku 3 sells 1 unit is is actually 1 of sku 1&2?
Thank you, I thought it would be an easy solution as an ERP system report. I Will ask thé project lead to look into it.
Is SQL an option? If not, powerquery both sheets into a single workbook and build a data model in excel.
Coach
Please show screenshots of sample of input data and desired result, from there it will be easy to give accurate answer
Subject Expert
Step 1: Identify the maximum number of "components" a single SKU can have
Step 2: in either Sheet 1 or a replica, create additional columns with components and quantity (similar to sheet 2 table); where the number of columns will be equivalent to the number of step 1 x 2 (since for all "components" you also have "quantity"
Step 3: Assuming you only have unique SKUs in sheet 2, do:
=FILTER(table_2_range,(table_2_SKU_range=table_1_SKU))
Step 4: perform any operations you may need in this new table - which is basically a copy of the table in sheet 1, but with additional columns with the components presented in table 2
Subject Expert
Np - good luck! If you need help with the formulas, feel free to reply :)
You can use PowerQuery in Excel, first step you need to transform your Bundle details data by SKU one rows for each component, then perform a merge query / join and then add in additional calculations
Thank you…I will brush up the power query skills over the weekend :)
Ask ChatGPT
Thanks but it didn’t work.
How do you not know how to do this…