
Related Posts
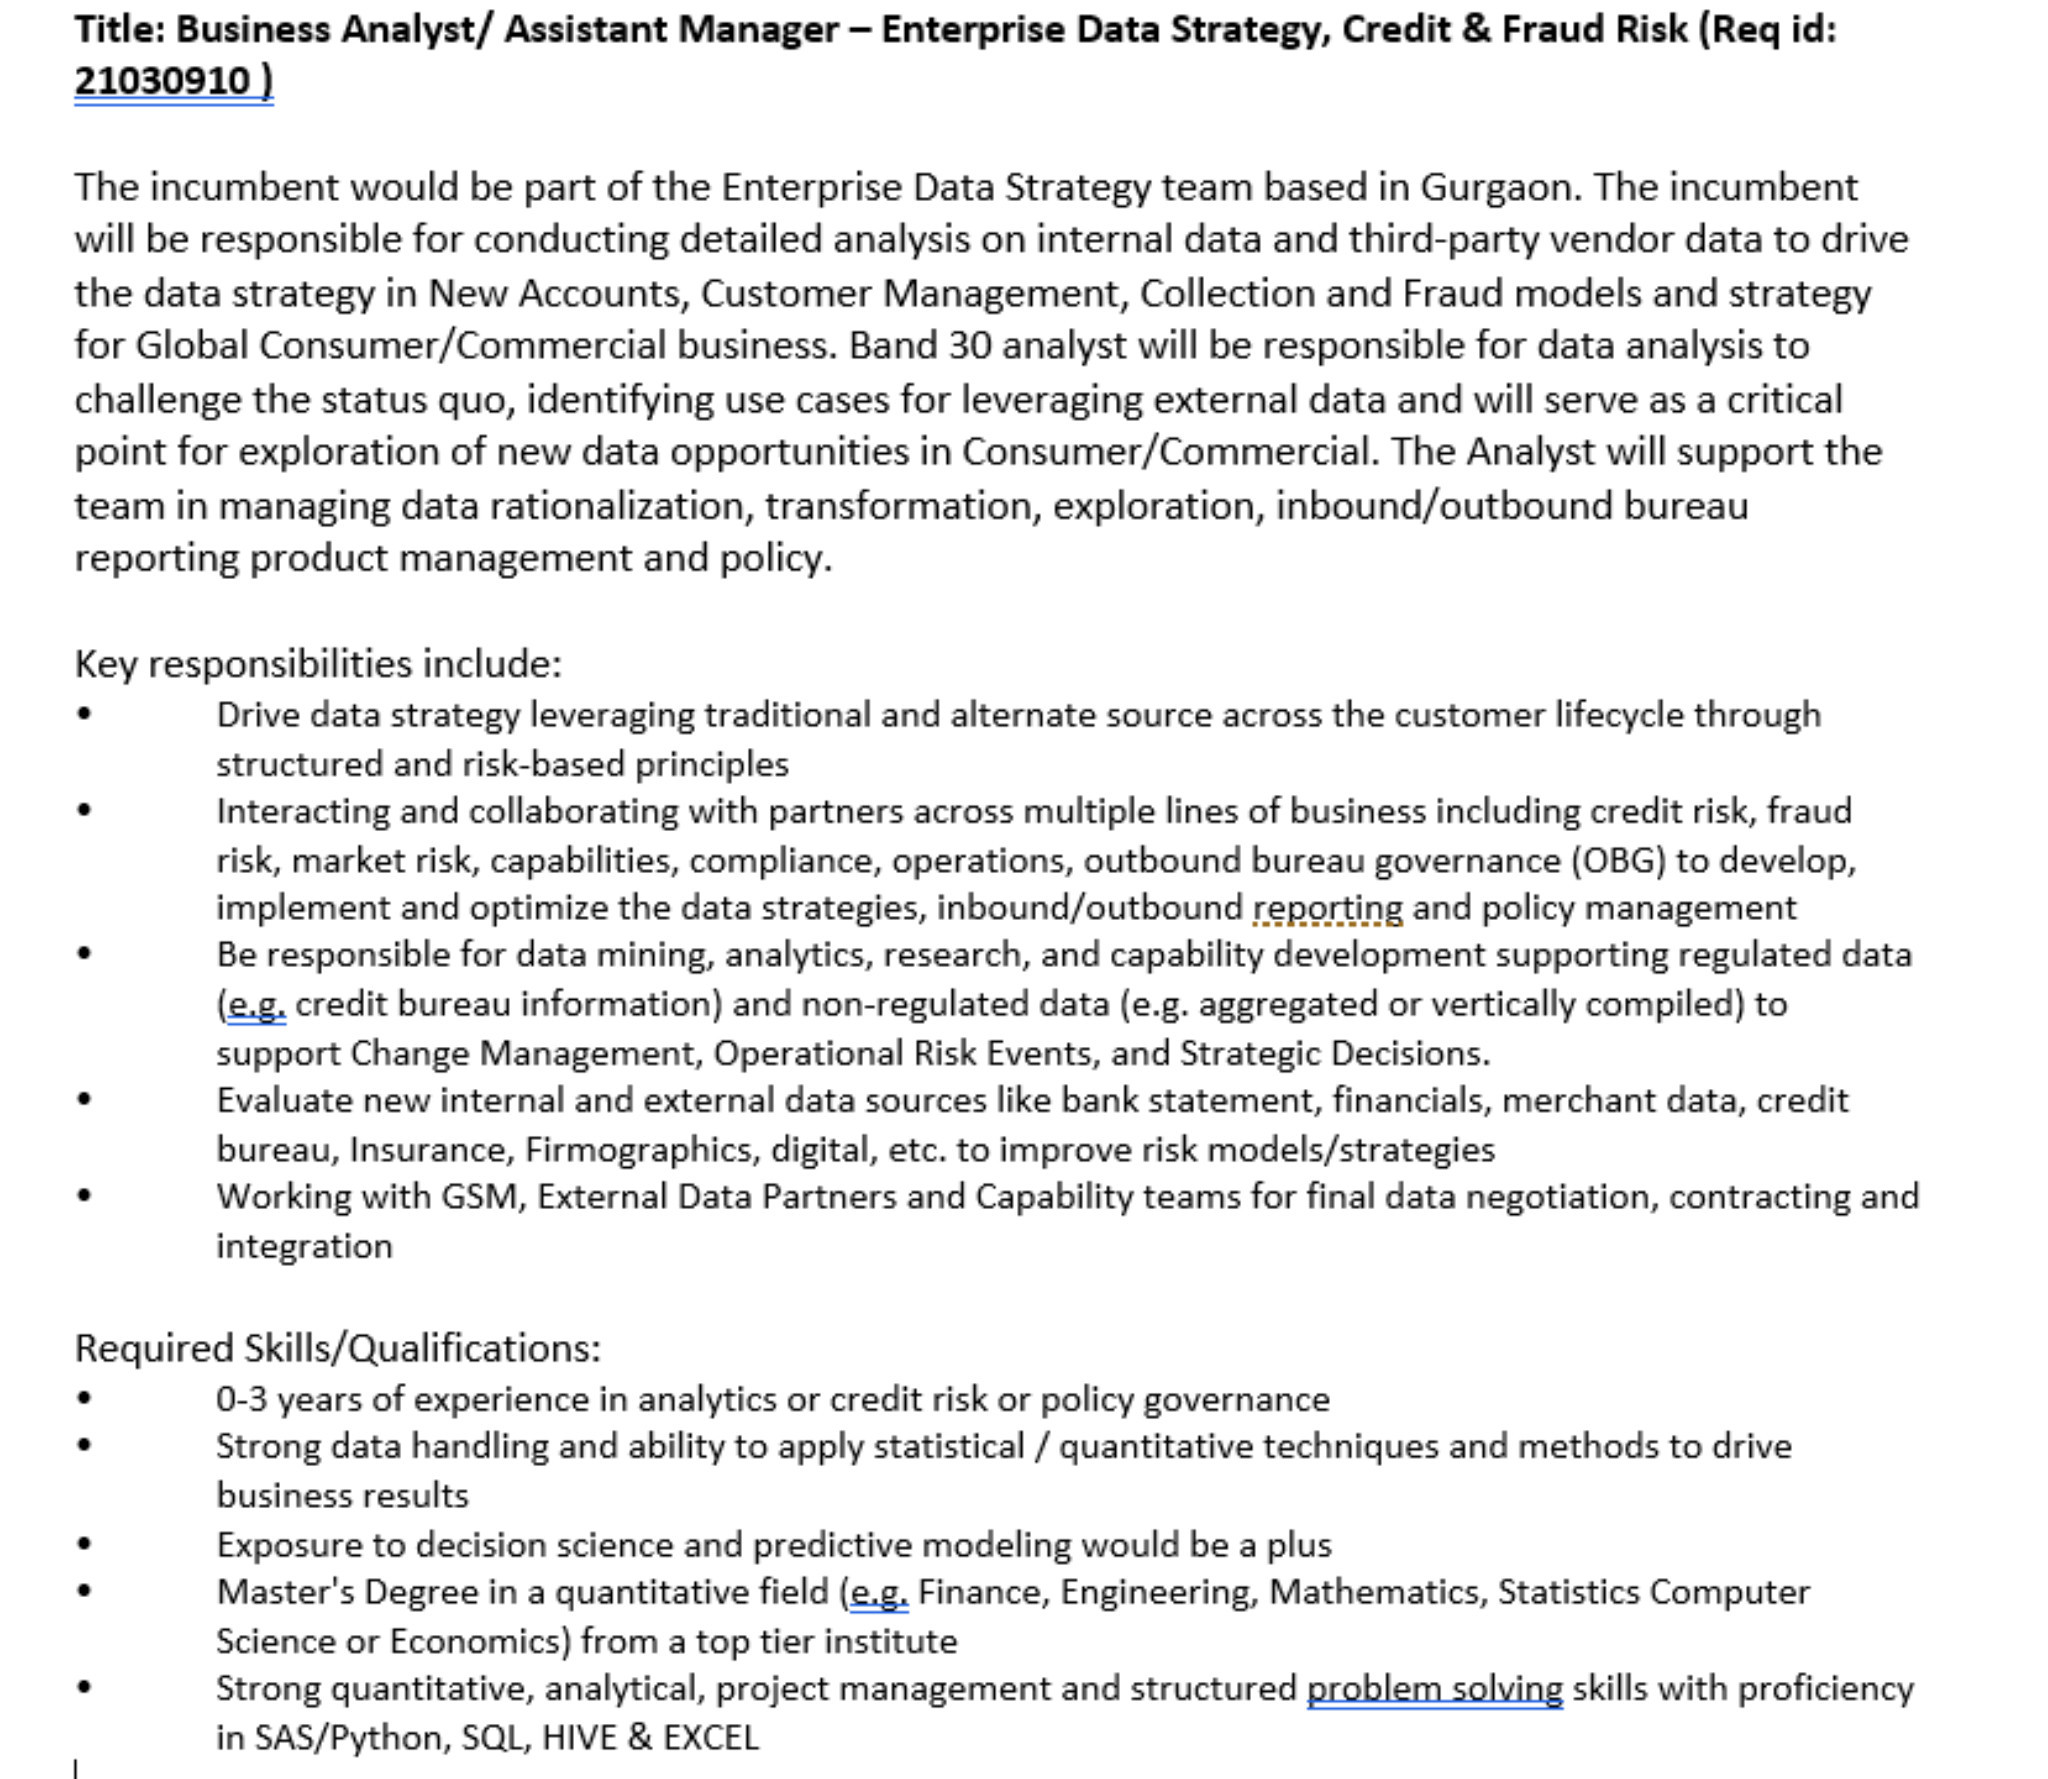
Please mail your CV to ammar.azizi1@gmail.com along with the Job ID from the EY careers website ( https://careers.ey.com/ ) for a referral. Please only send your CV if you have not applied directly or already asked someone else to refer already.
Please also DM me here because sometimes the CV goes into my spam folder. Cheers!
Bowl Leader
More Posts
Rajma is bae 😍

Best place for holiday office parties?
Please mail your CV to ammar.azizi1@gmail.com along with the Job ID from the EY careers website ( https://careers.ey.com/ ) for a referral. Please only send your CV if you have not applied directly or already asked someone else to refer already.
Please also DM me here because sometimes the CV goes into my spam folder. Cheers!
Rising Star
Ugh. So much work. 😩
Mentor
WPF merging with Alight Solutions!
Additional Posts in Data & Analytics Consultants
Bowl Leader
Bowl Leader
Thought this was interesting. Across 160 teams of researchers, just about all failed to make good life outcome predictions on things like GPA, evictions, layoffs, and others. Data followed 4.5k families across 15 years, with 13k features (varied over time). Haven't looked at it directly yet, but will be turning the docs and data inside out... In the meantime, authors claim this as showing the limits of ML. Oh, and it's published in PNAS, so you know there's some big publication energy there.
https://www.pnas.org/content/117/15/8398
New to Fishbowl?
unlock all discussions on Fishbowl.


Read whatever documentation is available, and prior reporting / files for context clues. Then set up meetings w senior analysts / form good relationships w them so they can assist in any future endeavors as you’ll need their insights.
This happens more than it should. If you don’t have a dictionary and have some free time/no deliverables or tight deadlines is a good idea to start making your own. With the lack of documentation you’re going to have to ask coworkers and other people on the project if they know what the Columns mean. I assume these databases are a combination of many different ones so it will help to know the source of the information when figuring out columns. 
You can also run a basic function depending on what program you’re using to at the very least see the column types. 
When figuring out column it also helps to run descriptive statistics. This can help you figure out what the columns mean if you’re stumped. 
EDA (exploratory data analysis), start with the totals and then slice and dice them and always make sure they add up to the previous total. Make some charts, look at trends and distributions. Then ask questions about the insights and if they meet expectations. Don’t wait or look for documentation... it never comes and doesn’t exist
I’d ask other teams what reports they run , what fields they use or what the most relevant information is. Also ask someone to help you map company lingo to what it’s actually called in the data. When I first joined BCG I wasn’t totally aware of the difference in all the titles but was extremely important when viewing data.
Very little documentation is a bit hard to work with!
1. You should ask for a data dictionary and if possible an entity relationship diagram (I.e how are the different tables linked).
2. Schedule a data discovery session with your tech team or data owner to get an overview of main data sources and datasets if there are limited technical artefacts.
3. Play around with data by creating summary stats, profiles and distributions to link it with business understanding (how many customers, what’s their demographics and regional split, how many low/medium/high value, what product or plan they are on etc). Reconcile it with existing reports or dashboards so that you are sure you’re looking at the fields correctly and synthesising the right variables.
4. Develop a deeper understanding by linking various dimensions to create customer personas and profiles - that way you’ll learn how to effectively use data to also understand business and subsequently identify opportunities and issues.
Hope it helps.
First of all, thanks for asking this question. I’m still relatively new to analytics and this has happened to me on each new job.
In addition to all mentioned above - one of the most helpful things for me was to get useful bits of queries/scripts from colleagues just to understand what tables/columns they were using, and especially the joins. Once I had a solid list of “most used tables” I got to exploring those.
Subject Expert
One common thing missing in the comments here is to understand the end goal and problem you are trying to solve using data.
It’s impractical and very very time consuming, almost every time, to familiarize yourself with most, let alone all, tables in a firm. So, a better way would be to move backwards from the end goal and ideate on what kind of features might help. Subsequently, look for relevant datasets and focus on those.
As you talk to your team members, you would probably expand on the feature space and datasets you are looking for.
Do some ground work as others have recommended. Several times names of features are obvious. Perform some validity checks on the nature of entries, summarize them and validate the intuition with experienced folks on the team.
1. Check any existing reports. You can use it as reference.
2. Discuss with senior team members how they have used it before.
3. Do some preliminary analysis and share the analysis with people and gather feedbacks
If you are the Analyst, there is an Engineer. BCG 2 has the most concise method to follow. Go find the Data Engineer/Architect in charge of the database and ask them.
Also, often on these database integrations, there is an integration manager they will have a very good business understanding of what the data is and why it is being brought together - if they are still around it's a good idea to reach out to them.
Consider building out a data dictionary as you are fact finding. It may evoke stronger inputs from stakeholders while also adding long-term value.
Bowl Leader
A lot of fantastic suggestions listed above. A few more off the top of my head, to do as you make your dictionary:
- check for legacy processes; some columns may be blank all together, or become uniform after a specific date (or other criteria)
- check the count of distinct values and distributions in each column; when there are few unique values, examine the top few, and when there are many, use count tables or histograms for a quick view of the distribution
- use cross-tables on column names that seem related to either other column names or values you've seen before
- make a correlation matrix for continuous variables, look for relationships that stick out
- graphing variables against each other can be helpful, but not when there are too many. Save this kind of plotting only for when it seems appropriate to the pair or as a last resort for variables you want to "squeeze" for info--and have some boiler plate plotting code on hand when you do
Wow a lot of amazing feedback here!! Thank you guys for taking the time to provide me with very detailed and thorough advice here. I very much appreciate it and know how to start now :) you all just increased my business value!!