
Related Posts
More Posts
Best west coast pharma agencies?
Why is EPOR so cheap?
Guys please give likes to enable chat for me.
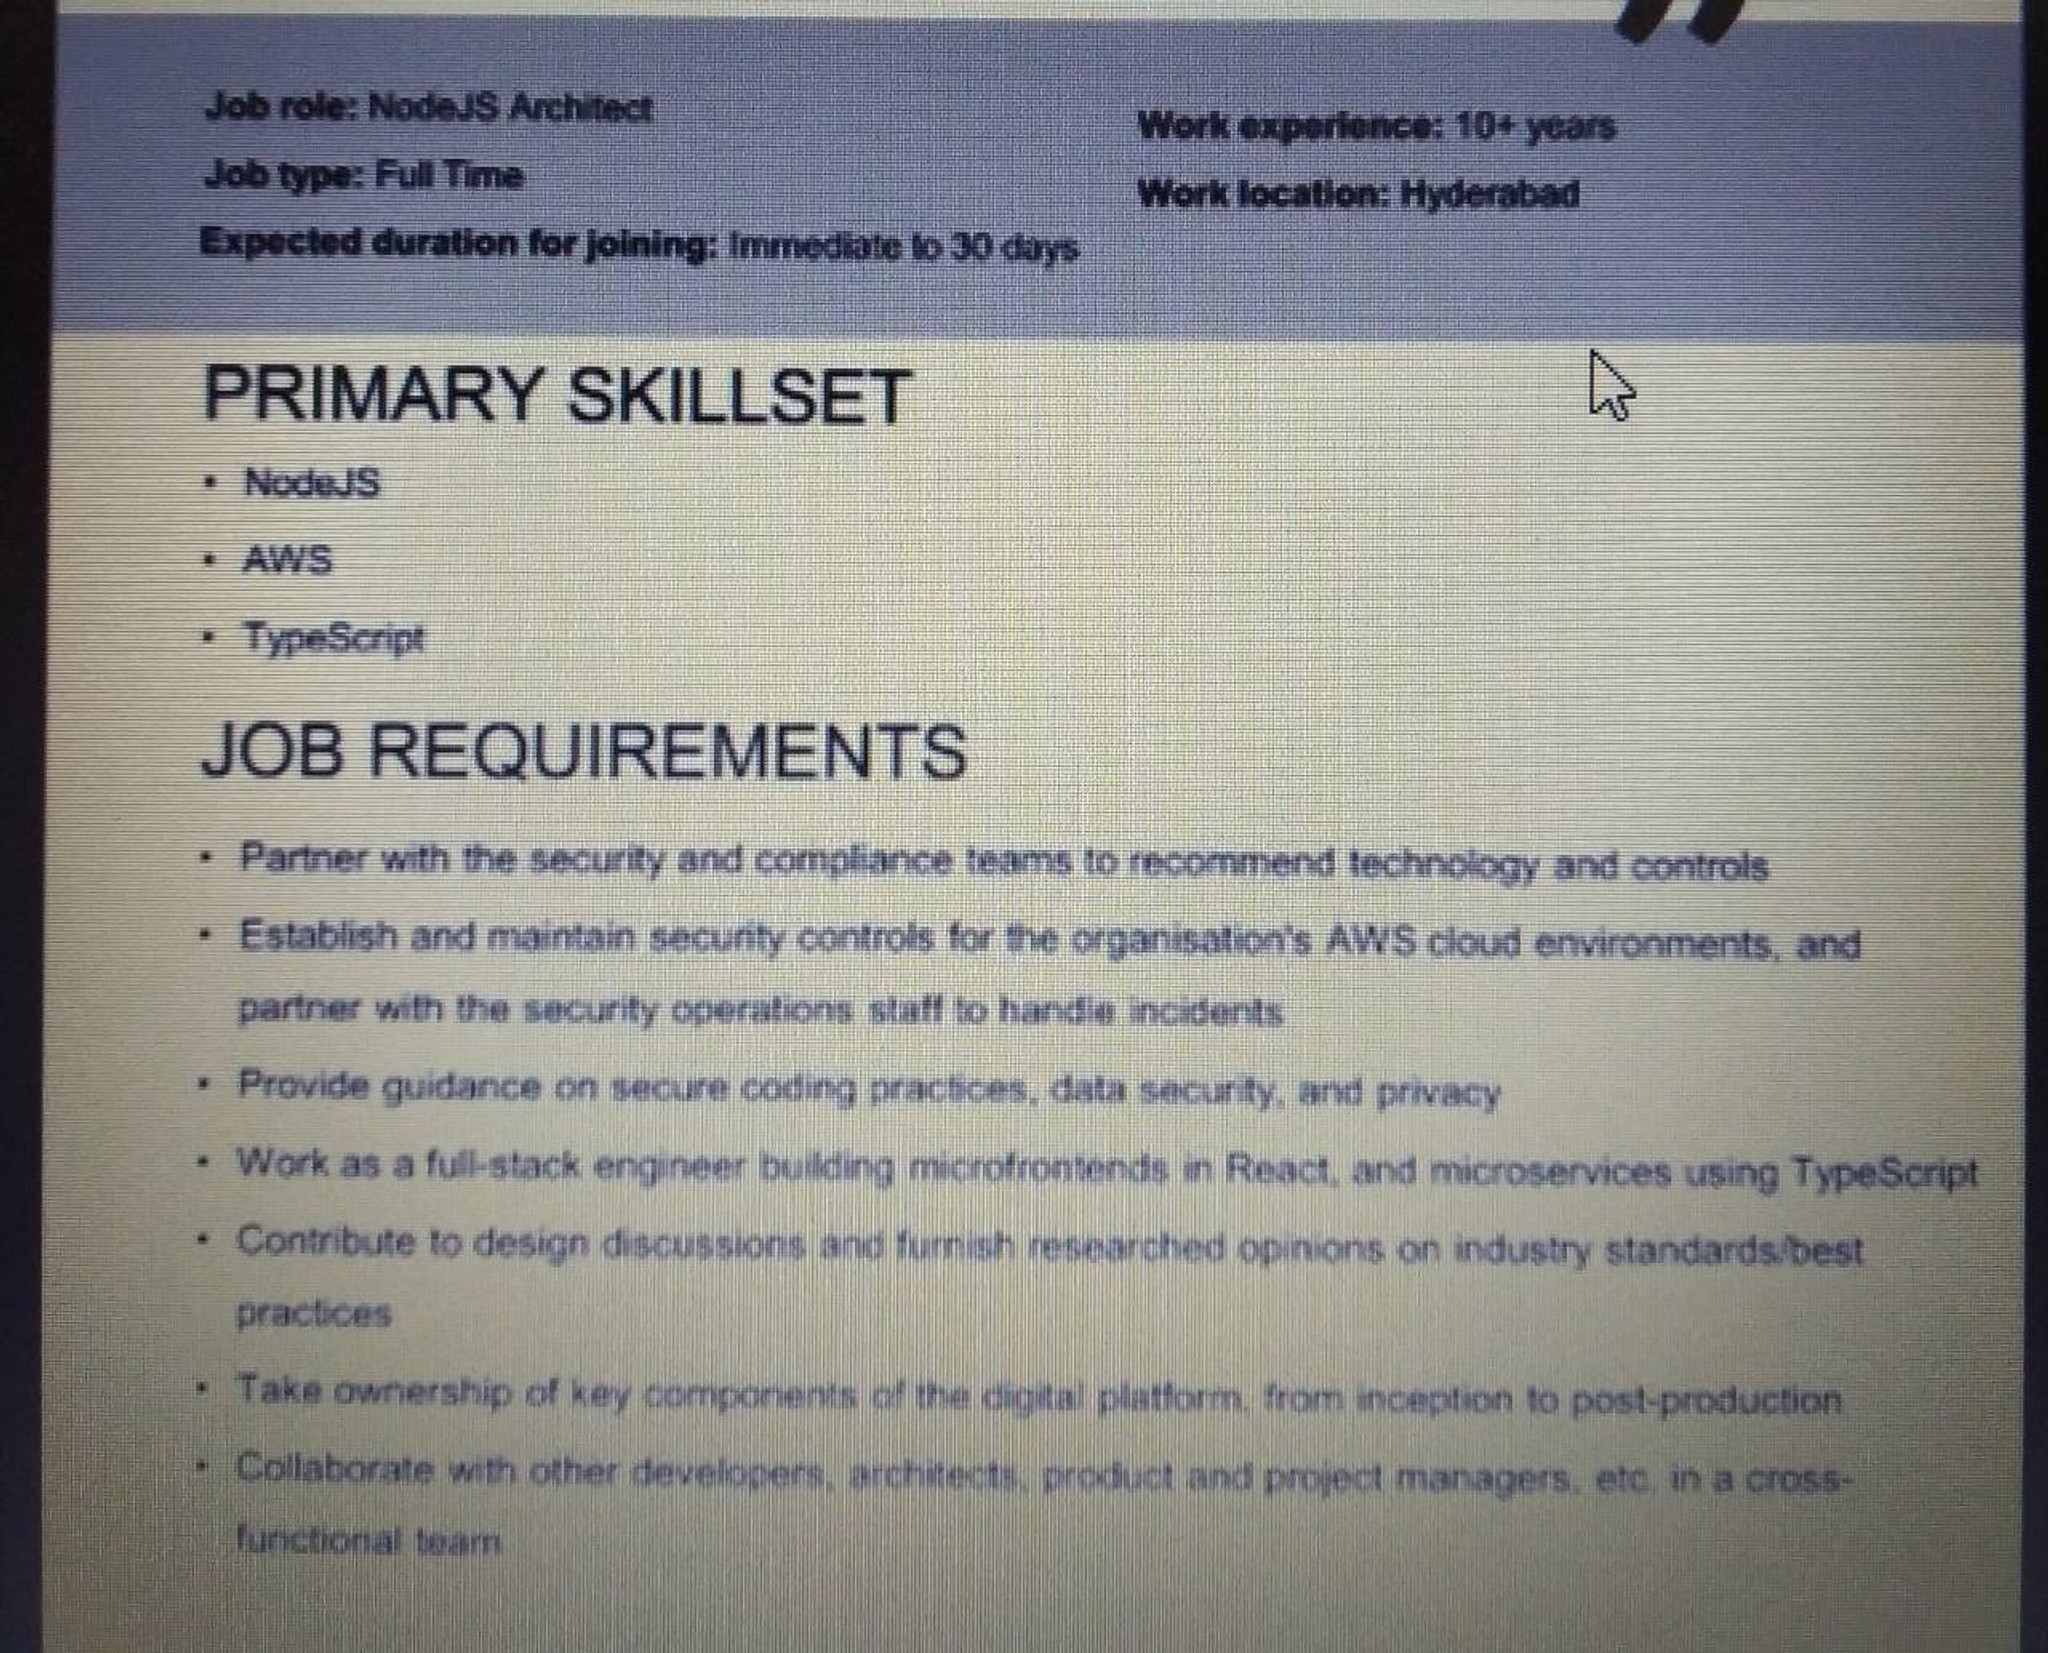
Chief
How do you all role out your ERG
Conversation Starter
Forwarded from a friend, is this true?Barclays

Anyone going in on VNET?
Additional Posts in Data & Analytics Consultants
Community Builder

Subject Expert
New to Fishbowl?
Download the Fishbowl app to
unlock all discussions on Fishbowl.
unlock all discussions on Fishbowl.


The training videos on Tableau’s site are pretty solid. That’s where we usually start.
If you want more advanced training bootcamps are helpful, but between the free resources as well as community you’ll find more than enough to get comfortable
Honestly if you’re good with excel tableau isn’t that bad. I learned by trying to re-create a couple dashboards using a slightly different data set from the original.
Tableau is really just annoying to make pretty.
Just learn enough to get started, but I would recommend focusing on SQL and Python, as they align better with a statistical analyst skillset.
Tableau is just to visualize a preferred set of views.
Strongly agree.
Tableau is basically a glorified pivot chart maker and it’s main selling point is it’s easy and intuitive to learn the most often used functions.
There are so many videos on YouTube, Udemy and other sites to get started and the Tableau website/forums have a lot of good content and worked out examples on more advanced techniques
You can also use Tableau public, which is the free version to try out new things as you learn
yeah you can totally do this in Tableau. it can handle basic stats. for more advanced stats you’ll need something else.
also the charts will look grainy if you try to paste them from Tableau into Powerpoint - that’s not one of Tableau’s strengths.
Tableau is a visual analytics tool. You bring the data into it after it's ready to go. They are working on adding additional statistical and machine learning functionality - what they're calling business science (play on data science) - but statistical analysis is typically done in R, python, or SAS in industry.
Power bi!
Best way to learn is to get your feet wet and start building things. I built a dashboard to visualize my monthly expenses and learned a great deal with that simple exercise. Then there’s DAX.
If you have a basic grasp of SQL, can make a pivot table in Excel and know just enough stats to be dangerous (far less than PhD rigor) you've got all the skills for some top notch 1st year BI analyst roles in 4 weeks.
Ummm, not sure either of your other responses have actually built anything in Tableau for a purpose, ie others, an organization, etc….
“Good excel skills” really doesn’t help you solve problems in the most efficient/effective way.
Besides that, the training videos I’ve seen from Tableau (at least a couple dozen) are super basic when it comes to real-world development
Honestly Tableau sorta scares me on this one. Dashboards create a presumption of being up to date, and can create a risk of non-anonymized data leaking if the org does not manage data rights well.(and the creator includes names & ids)
Start with a data set that is interesting to you. Bring it in to Tableau and start exploring. Use the questions that come up as you try to build things to learn about the tool— the “Show Me” menu, Google, and Tableau help are your friends.
Agree with others that Tableau has good free help videos, and the software comes with datasets that you can use to follow along with the videos. You can also join the Tableau community, ask questions in a forum, and you’ll receive a good amount of support pointing you in the right direction.