

Related Posts



Rising Star
Really worrying Job security in Cognizant after hearing 36% attrition rate ( volunteer resignation or forced) Is it good decision to join in Cognizant as a Sr associate project role without having prior lead experience My last working day is on this Friday Have offers in hand from Coforge ltd ( Technical analyst role) and Attra infotech (Similar as Technical analyst role) other than Cognizant Tech stack : Mainframe Developer #Urgent #Needhelp

More Posts
Does the sf office have lockers?


Pro


Mentor
Additional Posts in Excel Genius
Would anyone be willing to teach me vlookup?

New to Fishbowl?
Download the Fishbowl app to
unlock all discussions on Fishbowl.
unlock all discussions on Fishbowl.


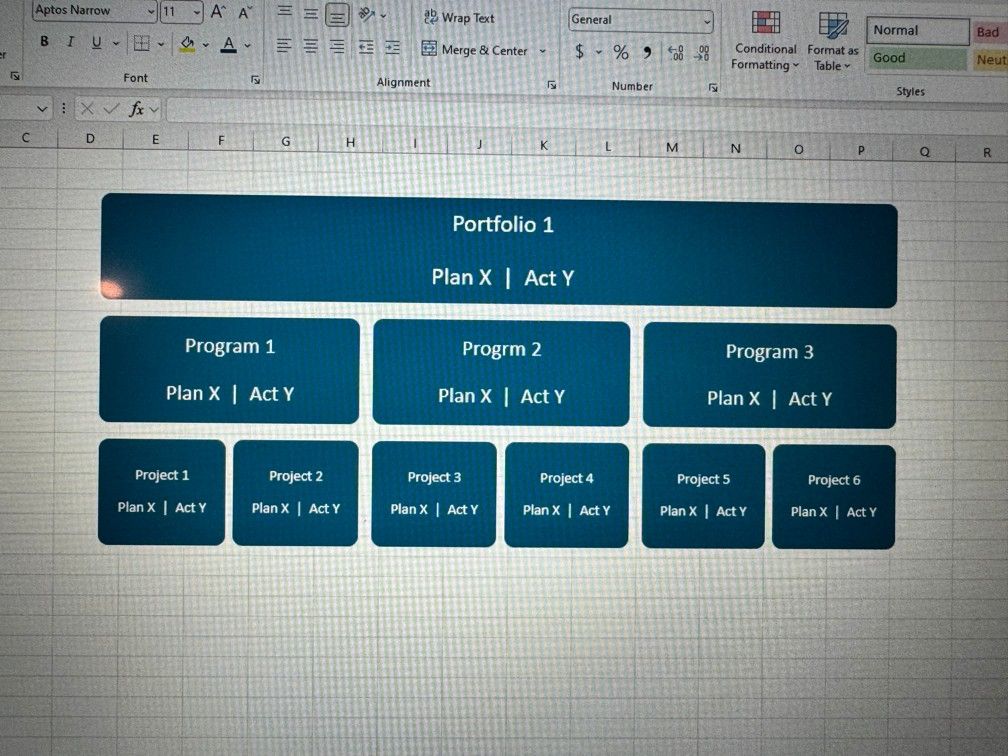
You can load the data in Power Bi and use a tree chart.
Looks good
If you don’t have tableau, I’ve previously used Vizio for tasks like this. At the end of the day, it’s a waterfall chart. You have the freedom to make it look as visually pleasing as possible, but it also doesn’t matter that much.
Decomposition tree might do the trick depending on how data is organized
Can also do text boxes with linked values
For overkill. This could look good in a Sankey Diagram. Look it up on PBI.
ouuu that's interesting`!