
Related Posts
I want more money



Conversation Starter
The basis of my bitcoin investing thesis

Is anyone planning on trading water futures?

Bowl Leader

So interest rates are really going down?

More Posts
Bowl Leader

Bowl Leader

Pro
Hi Guys,
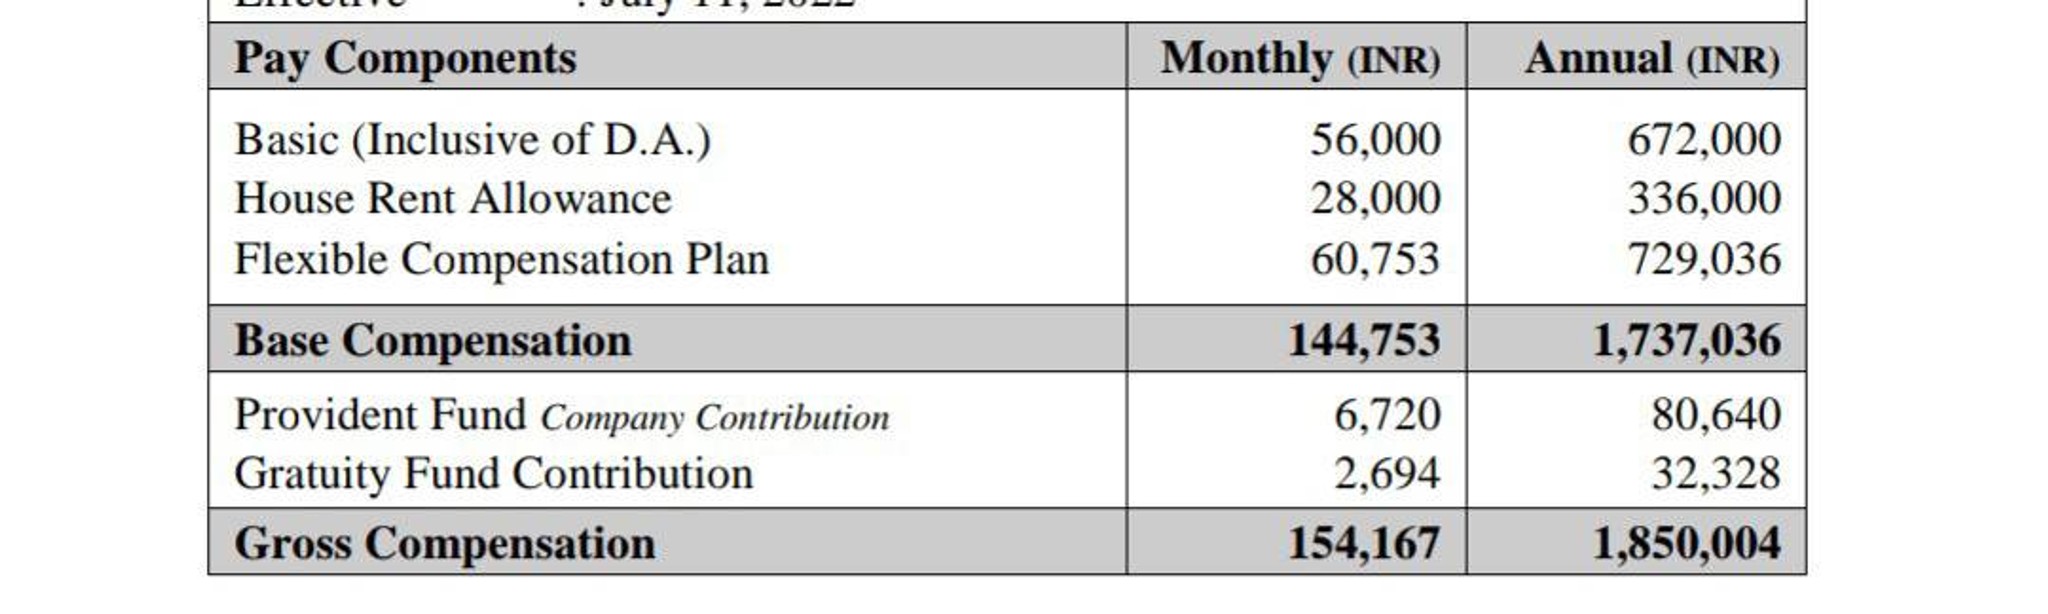
I have joined Ofss 1 week back and on second day itself I was allocated to project and onboarding WIP I received mail stating to report back to office 3 days per week under hybrid work model policy.Is this compulsory my base location is 2600 km from my current location as I am joining the citi project its seems difficult for me to grasp things though I have only 1 yr of prior exp by I think my team is expecting a lot so moving to new city and learning at same time is not possible .
Bowl Leader
Additional Posts in Excel Genius
Still don't have xlookup. #fomo
Anyone know what these badges are?


Visual Storyteller

Coach

New to Fishbowl?
unlock all discussions on Fishbowl.


I use Excel for all of my personal and business financials
Model income, expenses, cash flows, balance sheet
Yes. Standard budgeting of inflow and outflow of cash. Also investments.
Can you folks share the templates you’re using?
Project take home pay (income) vs projected expenses (fixed and variable), then compare against actuals and adjust your budget accordingly. It’s best to conservatively build in all anticipated expenses into your budget (housing, groceries, insurance, phone bill, utilities, gas, car expenditures, etc). I recommend building in planned savings as well if you’re able to.
I only check my actual expenses once or twice a month to see how I did, although I have an idea how I’m pacing - see below.
It’s helpful to know your avg. daily allowance in the back of your mind to know how you’re pacing. I.e., avg. daily take-home pay (net annual income/365 days in a year) less avg. projected daily expenses and planned savings/365 days in year.
Let’s say you average $150 a day in take home pay and your projected expenses plus planned saving is $100. Then you have a $50/day allowance that can be used as fun, unexpected costs, add’tl savings, whatever. And there will be times you go over, but try to course correct to keep yourself within your budget.
I tried, but Excel doesn’t handle imaginary numbers well. sqrt(-1💵) = 💸💸💸
Yes. Track/chart my credit card/loan balances/utilization ratios to optimize my credit score.
Yes. However I want a better way to track expense types (not just cumulative how much I spend).
I already have home/bills broken out separately, as well as auto (payment, gas, insurance, etc).
I assume pivot tables are the best way to track those? Do others manually list transactions?
I use pivot elsewhere in excel but not super extensively. If I have a new sheet I add to from which the data pulls, can I have info from the pivot table (or new transaction sheet if not possible) be inserted on the original sheet as well?
To spice things up, I use “numbers” on my Mac for personal expenses, but functions are similar.
Been breaking down transactions in comments, but I’d love to just pull totals from the separate sheet (x and y cards’ monthly totals paid on z check’s line), and then be able to look at data from the transactions as I want to separately in the pivot.
Not meaning to hijack this post OP, but hopefully this is helpful for us both 😅.
Once your expenses are in a table format, categorized, then yes a pivot table is a clean way to organize that on your cover page. And yes it’s not a problem to use source data on a separate tab. I think your biggest hurdle is figuring out the easiest way to categorize your expenses. Most major banks have technology that can help automatically classify your expenses and can pull from various external data sources.
Yes for monthly budgets (mostly to teach my partner how to use Excel), and for projected pay downs for my credit cards because I get tired of calculating this by hand. I use a variation of the built in monthly budget template since it works well enough for us.
I don’t have a specific template for the CCs. Made a header with my cards, their limits, and the amount spent that corresponds with utilization % (they’re pretty high right now, so “bad” is broken down in 5% increments from 95-75, then “pushing it” is 50%, “okay” is 30%, and “good” is 10%). Under that is a quarterly breakdown of the statement and current balances, the APR, current utilization, goal utilization, projected interest cost, then an update at the bottom of what I actually achieved. I fill that in as I go along. Been able to knock down more than my goal utilization so far, so that’s nice.
Yes. I use excel for my grocery list. 😂
I use a combination. YNAB to execute allocation of funds and flow as expenses occur. Excel/Google Sheets to guide my biweekly allocation, and to also do other napkin math like IRA tracking, etc.
I do pretty religiously. I am looking for some help with Charting for a dashboard. Does anyone use charts?