
Related Posts
Rising Star
Ya’ll take ya vitamins today?
More Posts
Any thoughts on Laronde?
Community Builder


Additional Posts in The Worklife Bowl
Pro
Rising Star
Conversation Starter
My food life these days...

Just finished work. What’s everyone listening to?

Rising Star
Visual Storyteller
Conversation Starter
Rising Star
Chief
New to Fishbowl?
Download the Fishbowl app to
unlock all discussions on Fishbowl.
unlock all discussions on Fishbowl.


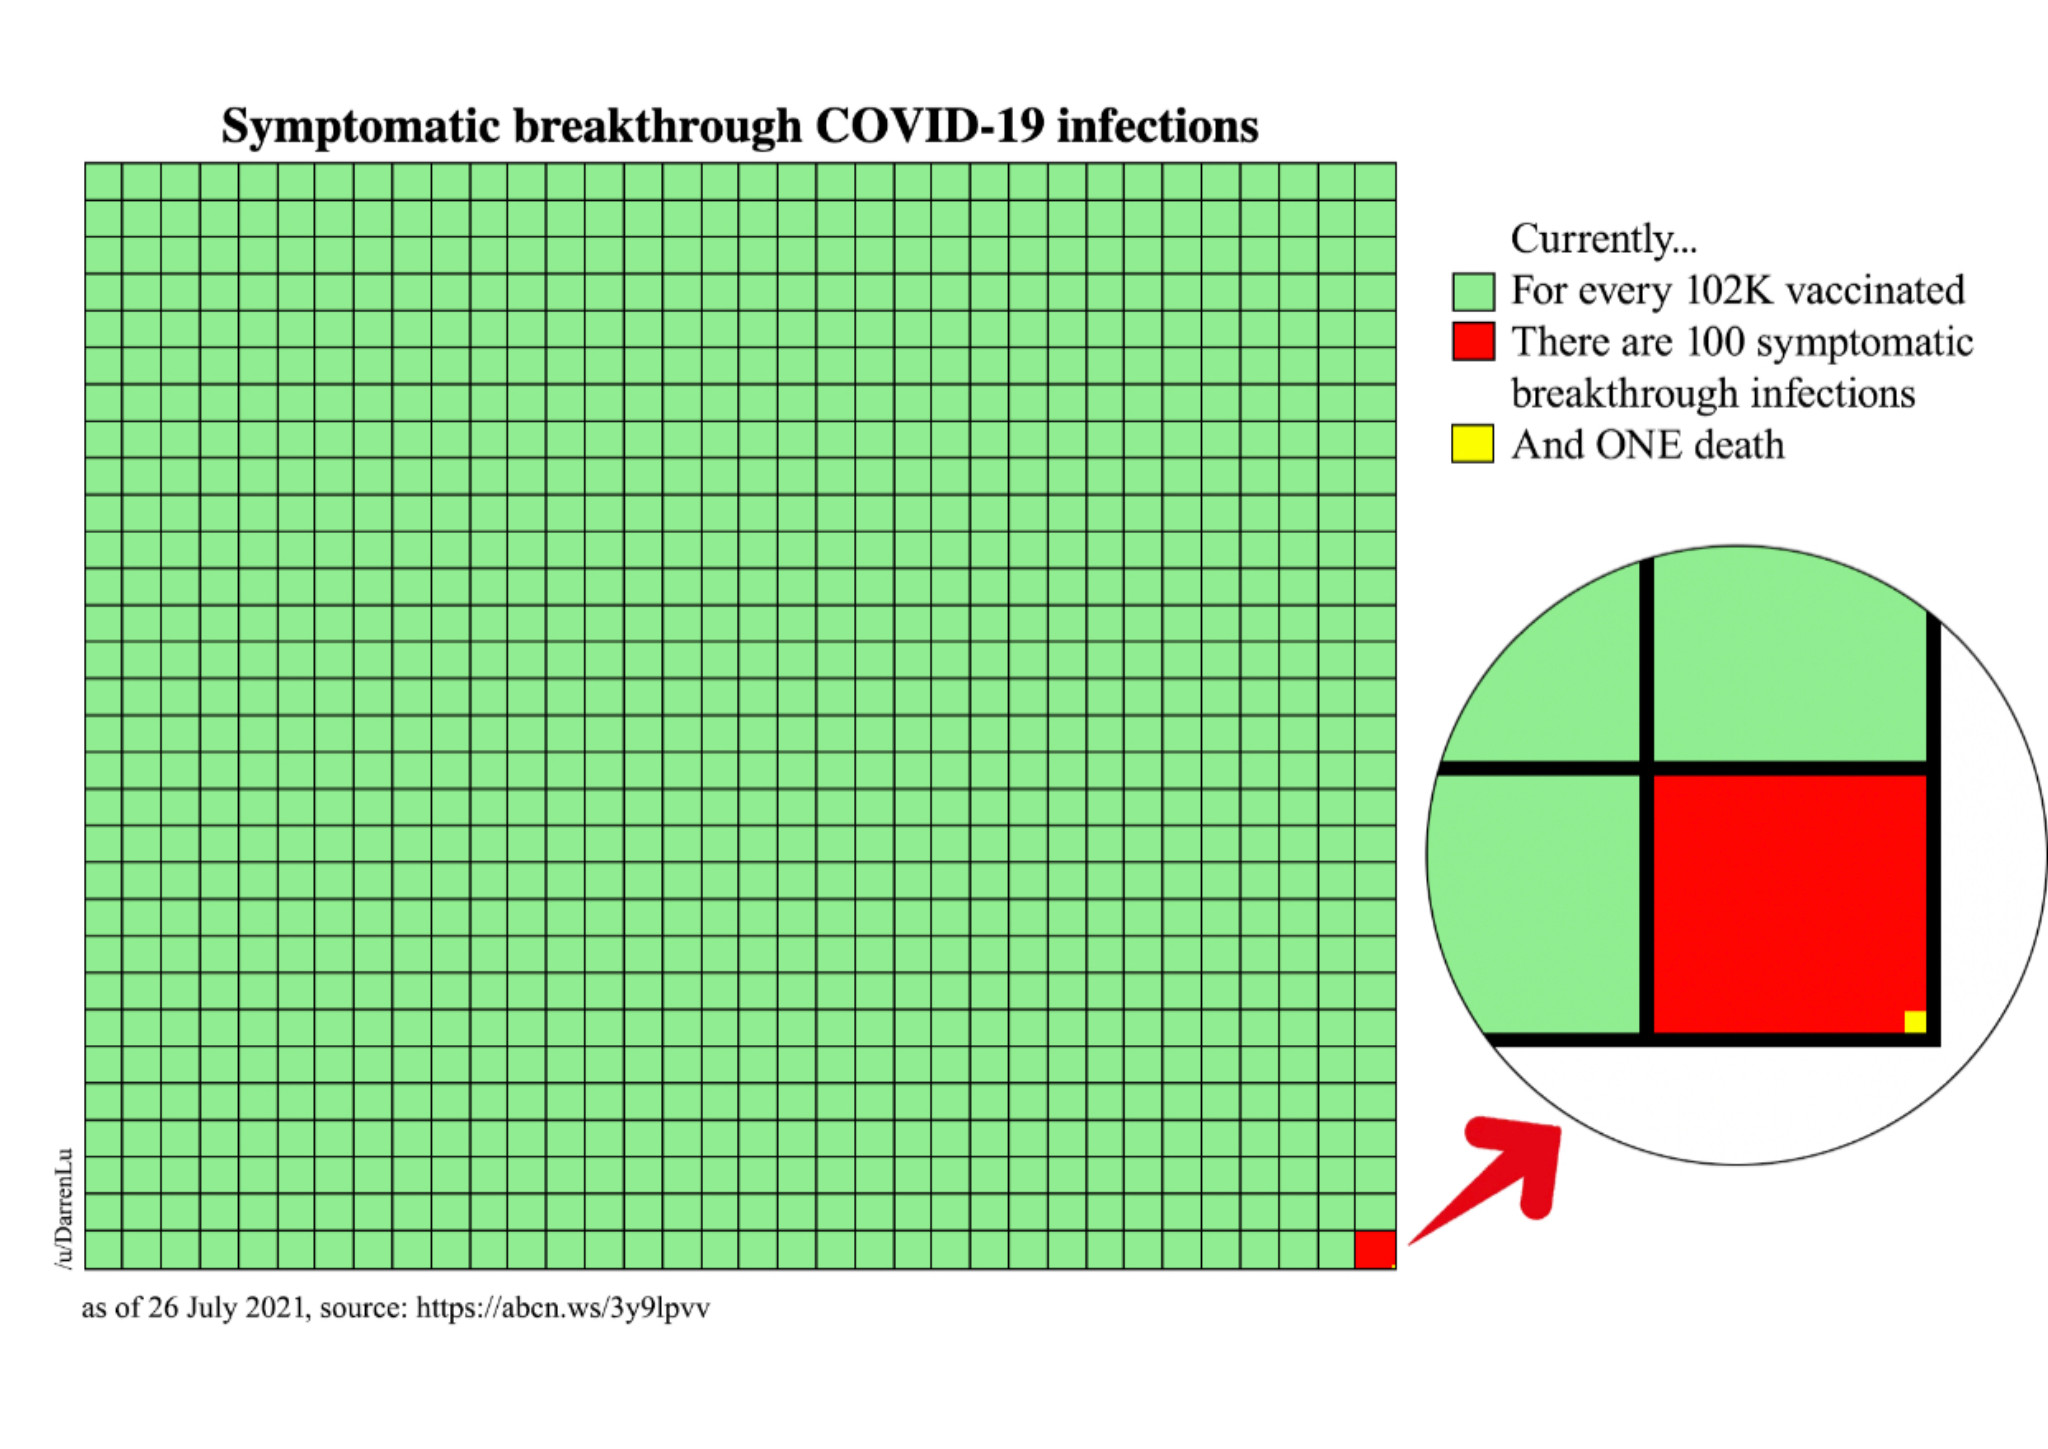
Maybe I’m dense, but I’m trying to wrap my head around how rare this graphic makes breakthrough cases seem, and the hundreds of symptomatic breakthrough cases that came out of just the Provincetown cluster between now and the 4th of July...
Rising Star
Because it hides exposure rate. Sure, a tiny fraction of people vaccinated have been infected, but only a small fraction of everyone vaccinated over the last 7 months have been exposed to Delta so far.
An equally true statistic is that 20% of the June infections in LA County were in people already vaccinated. Even if total infection count is low, that’s a very worrying ratio when you extrapolate exposures over the total population.
Rising Star
Ohh colorful. Anti vax bad!
What I don’t understand is why there’s now a distinction between asymptomatic and symptomatic cases. All throughout 2020 we were told that there’s no difference, even if you’re well you’re sick, but now there’s a difference?
Yeah my fully-vaccinated aunt in NM just got quarantined for 14 days due to an alleged exposure. Complete BS.
Would you care about the graph if you were in that yellow box?
Pro
There's a lot more yellow boxes in the unvaccinated graph. Also, no vaccine is 100% efficient but the MRNA vaccines have shown to have high efficiency overall.